Extending NetSuite Analytics with Formula Fields
by Sam Power on

Things are about to get a little technical, so if you have any questions about the content below, please get in touch with our team. This is where we can help!
In our monthly management meetings, I present our support statistics back to our management team and I base these on dashboards I have created using the Analytics module within NetSuite (NetSuite is used as our internal Case management system). I am often met with questions as to "how did you get Analytics to do that?".
As a result, this blog article was born. If colleagues are asking these questions internally, there are likely many NetSuite users facing similar challenges. Therefore, I have based the below on some real world challenges I faced with analytics and how I resolved them, making it slightly more generic to enable you to be able to see how you could apply them to reporting challenges you may be facing.
NetSuite Analytics provides a powerful reporting platform out of the box, but one of its most useful features is often overlooked: formula fields. By using SQL-style expressions within Analytics, organisations can create dynamic calculations, categorise data, and produce insights that would otherwise require custom development or manual spreadsheet manipulation.
How do I get to formulas?
The building block of any good Analytics report or chart is the dataset, this is the raw data it will be built on. For the examples below, I will be using a case dataset, this can be accessed from the top right of your Analytics Chart.
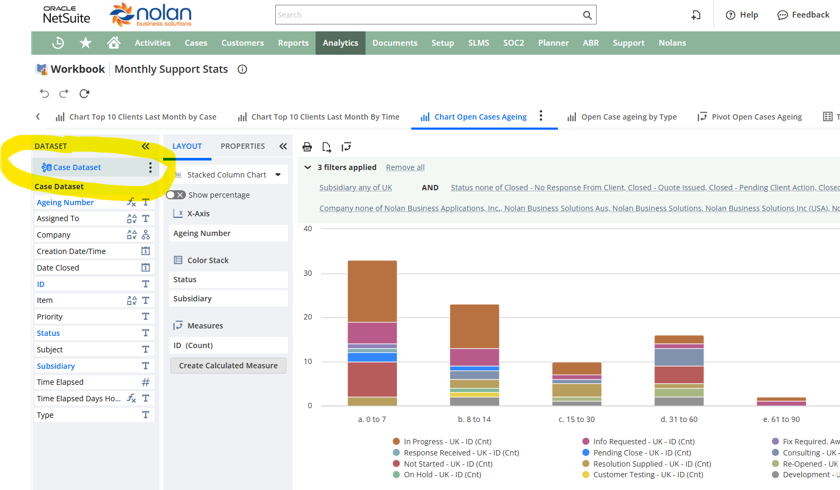
Once you have opened up the dataset (Ellipsis button next to Dataset), you can see the "Formulas" and the "New Formula button which allows you to create them.
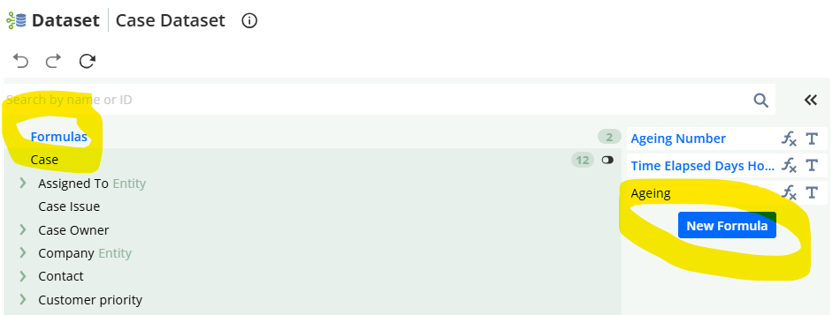
The creation of the formula is fairly intuitive, so I won't go into that here. However once created, the formula appear in your dataset ready to be used like any other field and can be brought into charts and pivot tables.
The Challenge
As mentioned above I am going to base this on practical challenges I faced whilst compiling meaningful reports for our management meetings. Many NetSuite records contain time-based metrics, such as case resolution times, task completion times, approval turnaround times, workflow durations and opportunity ageing. In this example, the field {timeelapsed} stores elapsed time in hours. While raw hours can be useful for calculation, they are not always helpful from a management or operational reporting perspective. Formula fields allow that raw value to be converted into more meaningful outputs.
|
Reporting Need |
Formula Approach |
Business Benefit |
|
Group records into ageing buckets |
CASE statement with calculated days |
Improves trend analysis and SLA monitoring |
|
Display elapsed time clearly |
FLOOR, MOD and CONCAT |
Makes reports easier for users to interpret |
Example 1: Creating Ageing Bands from Elapsed Hours
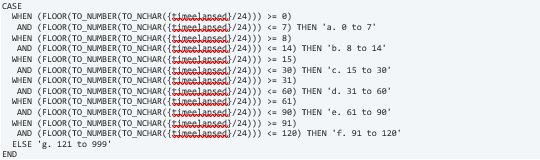
The first formula converts elapsed hours into days and then assigns each record to an ageing band. This is useful for dashboards, saved searches, workbooks and KPIs where users need to understand how old records are without manually interpreting raw hour values.
How the Formula Works
- The expression {timeelapsed}/24 converts elapsed hours into days because the source value is stored in hours.
- FLOOR() rounds the calculated day value down to the nearest whole number. For example, 20.83 days becomes 20 days.
- TO_NCHAR() and TO_NUMBER() are used to explicitly cast values so the formula evaluates consistently within NetSuite formula logic.
- The CASE statement then checks the calculated day value and returns the appropriate reporting band.
|
Days Elapsed |
Result |
|
0-7 |
a. 0 to 7 |
|
8-14 |
b. 8 to 14 |
|
15-30 |
c. 15 to 30 |
|
31-60 |
d. 31 to 60 |
|
61-90 |
e. 61 to 90 |
|
91-120 |
f. 91 to 120 |
|
121+ |
g. 121 to 999 |
The letter prefixes are useful because they help force the bands to sort in the intended order in reports and charts.
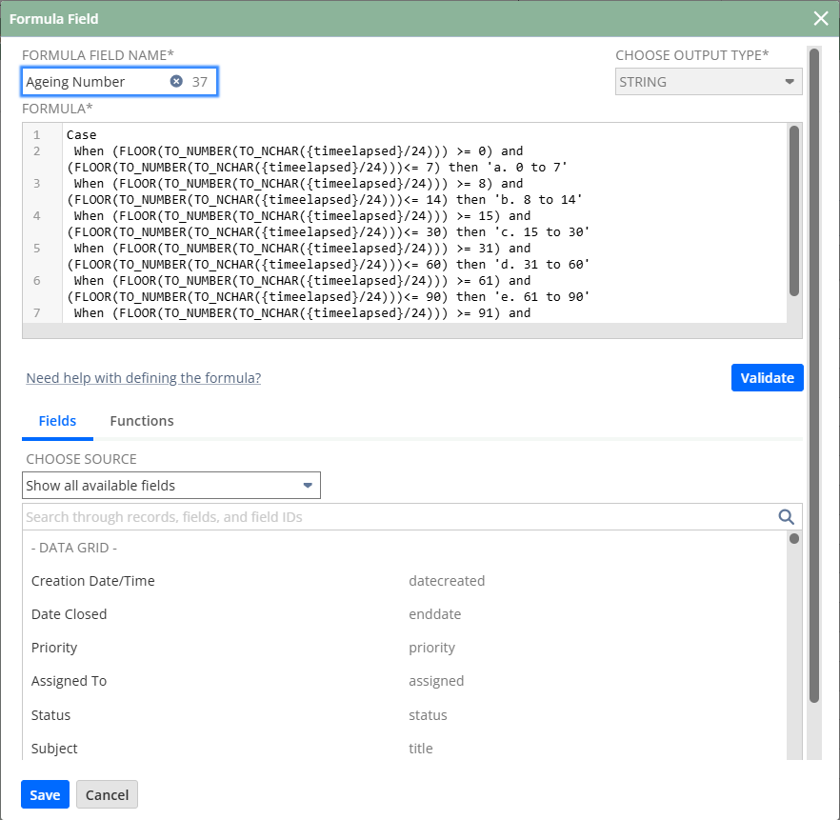
Below is an example of how the formula would appear in the formula section of the dataset when creating the formula.
Example 2: Displaying Elapsed Time as Days and Hours
The second formula demonstrates a different use of NetSuite Analytics formulas: transforming a technical value into a user-friendly display. Instead of showing a value such as 245 hours, the formula presents the result as Days: 10 Hours: 5. Because lets face it, no one wants to do that math in their head when looking at a chart.

How the Formula Works
- The first part divides {timeelapsed} by 24 and uses FLOOR() to calculate the number of complete days.
- The second part uses MOD({timeelapsed}, 24) to calculate the remaining hours after complete days have been removed.
- CONCAT() joins the labels and calculated values together to produce a readable text result.
|
Time Elapsed (Hours) |
Formula Result |
|
25 |
Days: 1 Hours: 1 |
|
48 |
Days: 2 Hours: 0 |
|
73 |
Days: 3 Hours: 1 |
|
245 |
Days: 10 Hours: 5 |
|
500 |
Days: 20 Hours: 20 |
Practical Business Uses
- Support case response or resolution times
- Professional services activities
- Project tasks
- Workflow approvals
- Customer onboarding processes
- Internal service level agreement monitoring
Once created as formula fields, these outputs can be used in Saved Searches, Workbook Datasets, Analytics Workbooks, KPI Scorecards, dashboard portlets, charts and graphs.
Unlocking the Power of SuiteAnalytics
These two examples highlight how formula fields can significantly enhance the value of NetSuite Analytics without requiring SuiteScript development or external reporting tools.
In the first example, a CASE statement transforms raw elapsed hours into meaningful ageing bands. This enables organisations to categorise records into manageable groups, making it easier to identify trends, monitor service levels and highlight records requiring attention.
In the second example, FLOOR, MOD and CONCAT convert elapsed hours into a user-friendly Days and Hours format. Rather than presenting users with a large number that requires interpretation, the formula produces a clear and understandable result such as Days: 10 Hours: 5.
Together, these examples demonstrate two common but powerful uses of NetSuite formulas: data categorisation and data transformation. By using formula fields within Workbooks, Saved Searches, KPIs and dashboards, organisations can unlock deeper insights from NetSuite data, improve report usability and create analytics tailored to real business requirements.
In a future article I will take a look at Datasets and getting the right data into them, I hope you found this useful and informative. If you are looking at doing more with your Analytics please contact our support team and we will help enable you to achieve your goals (or at least report on them).
